Web Resources for S&P 500 Data
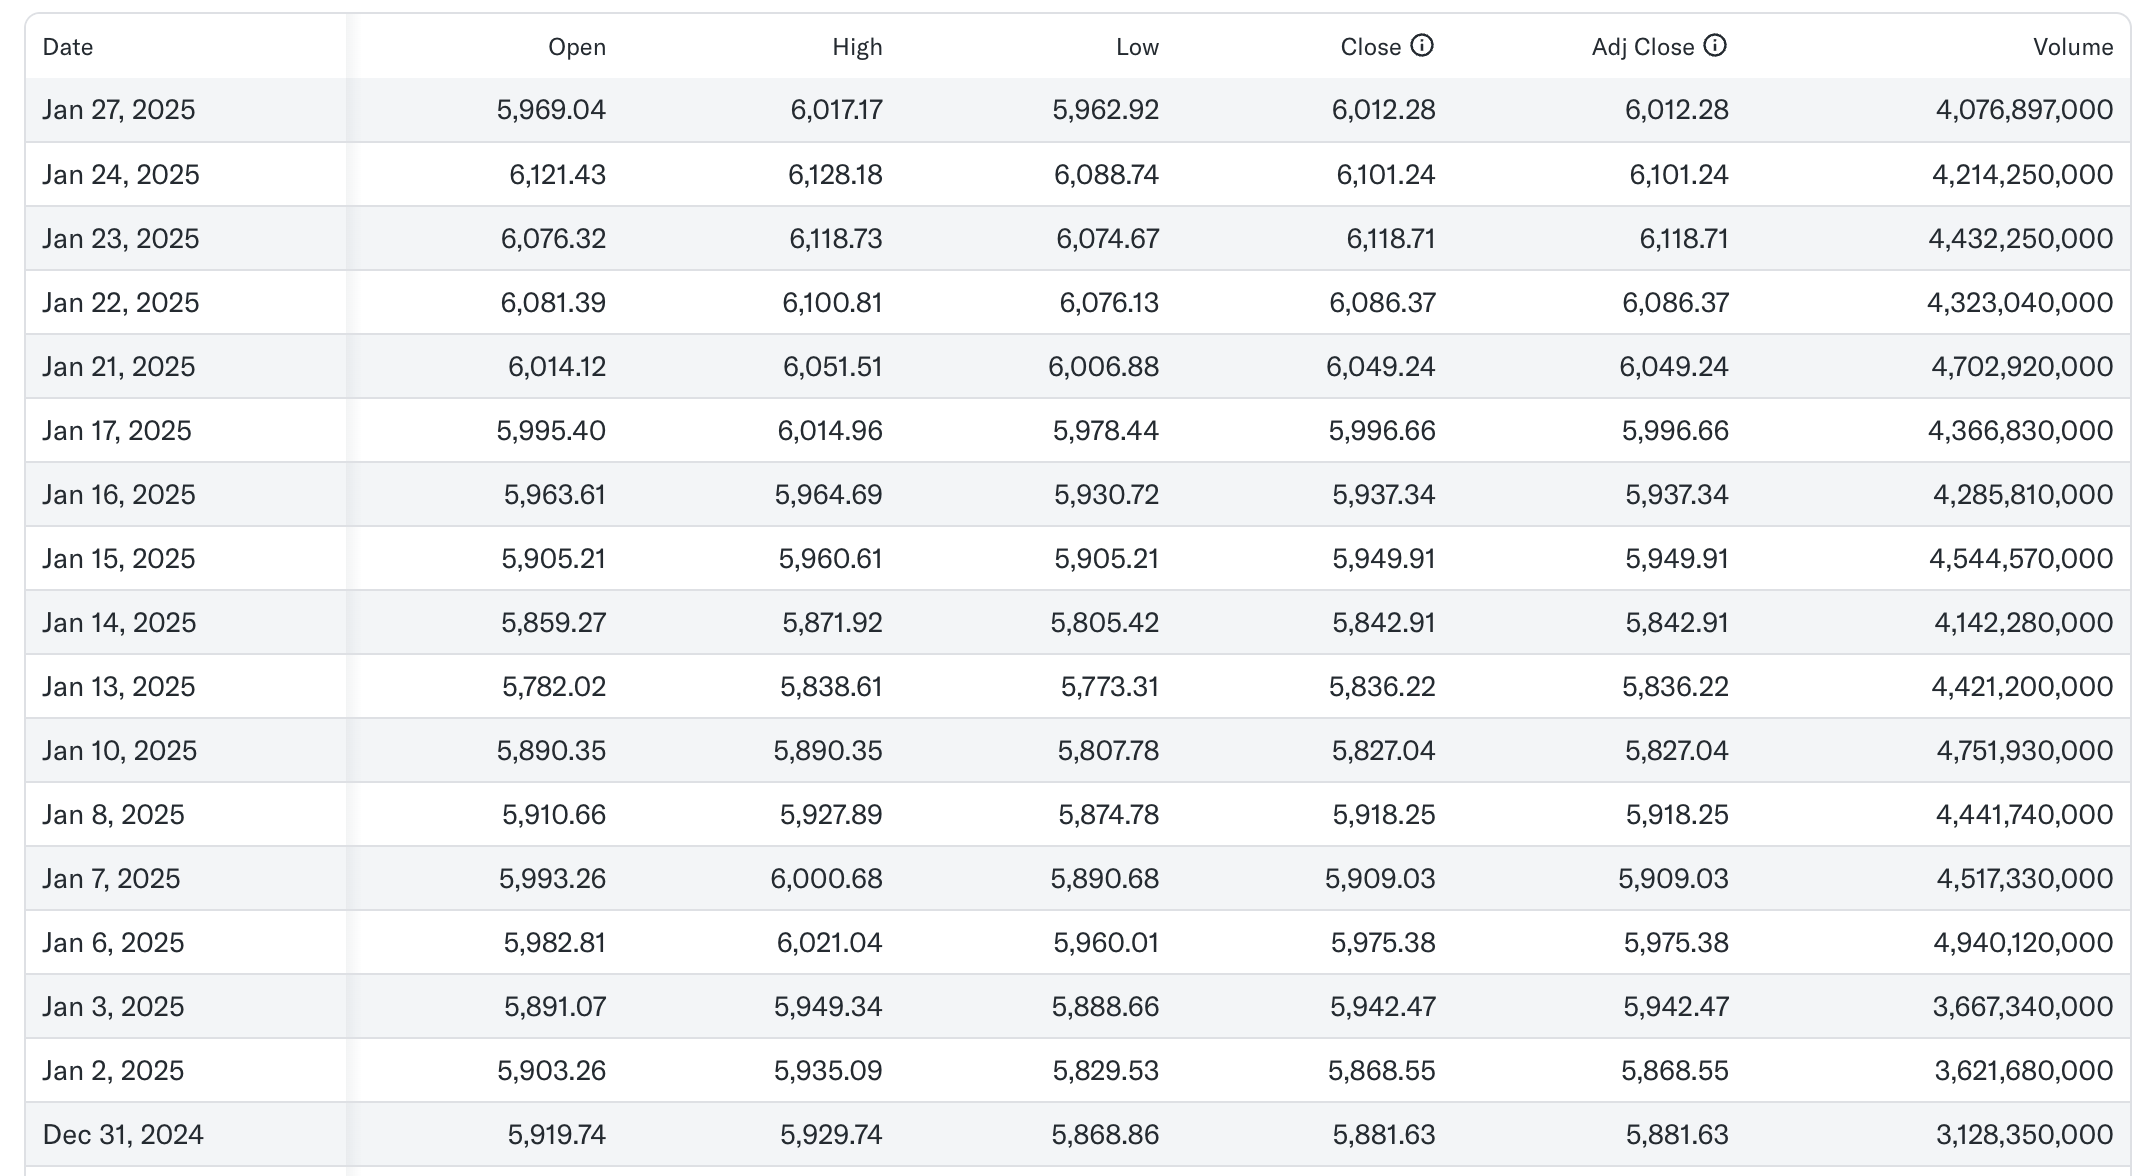
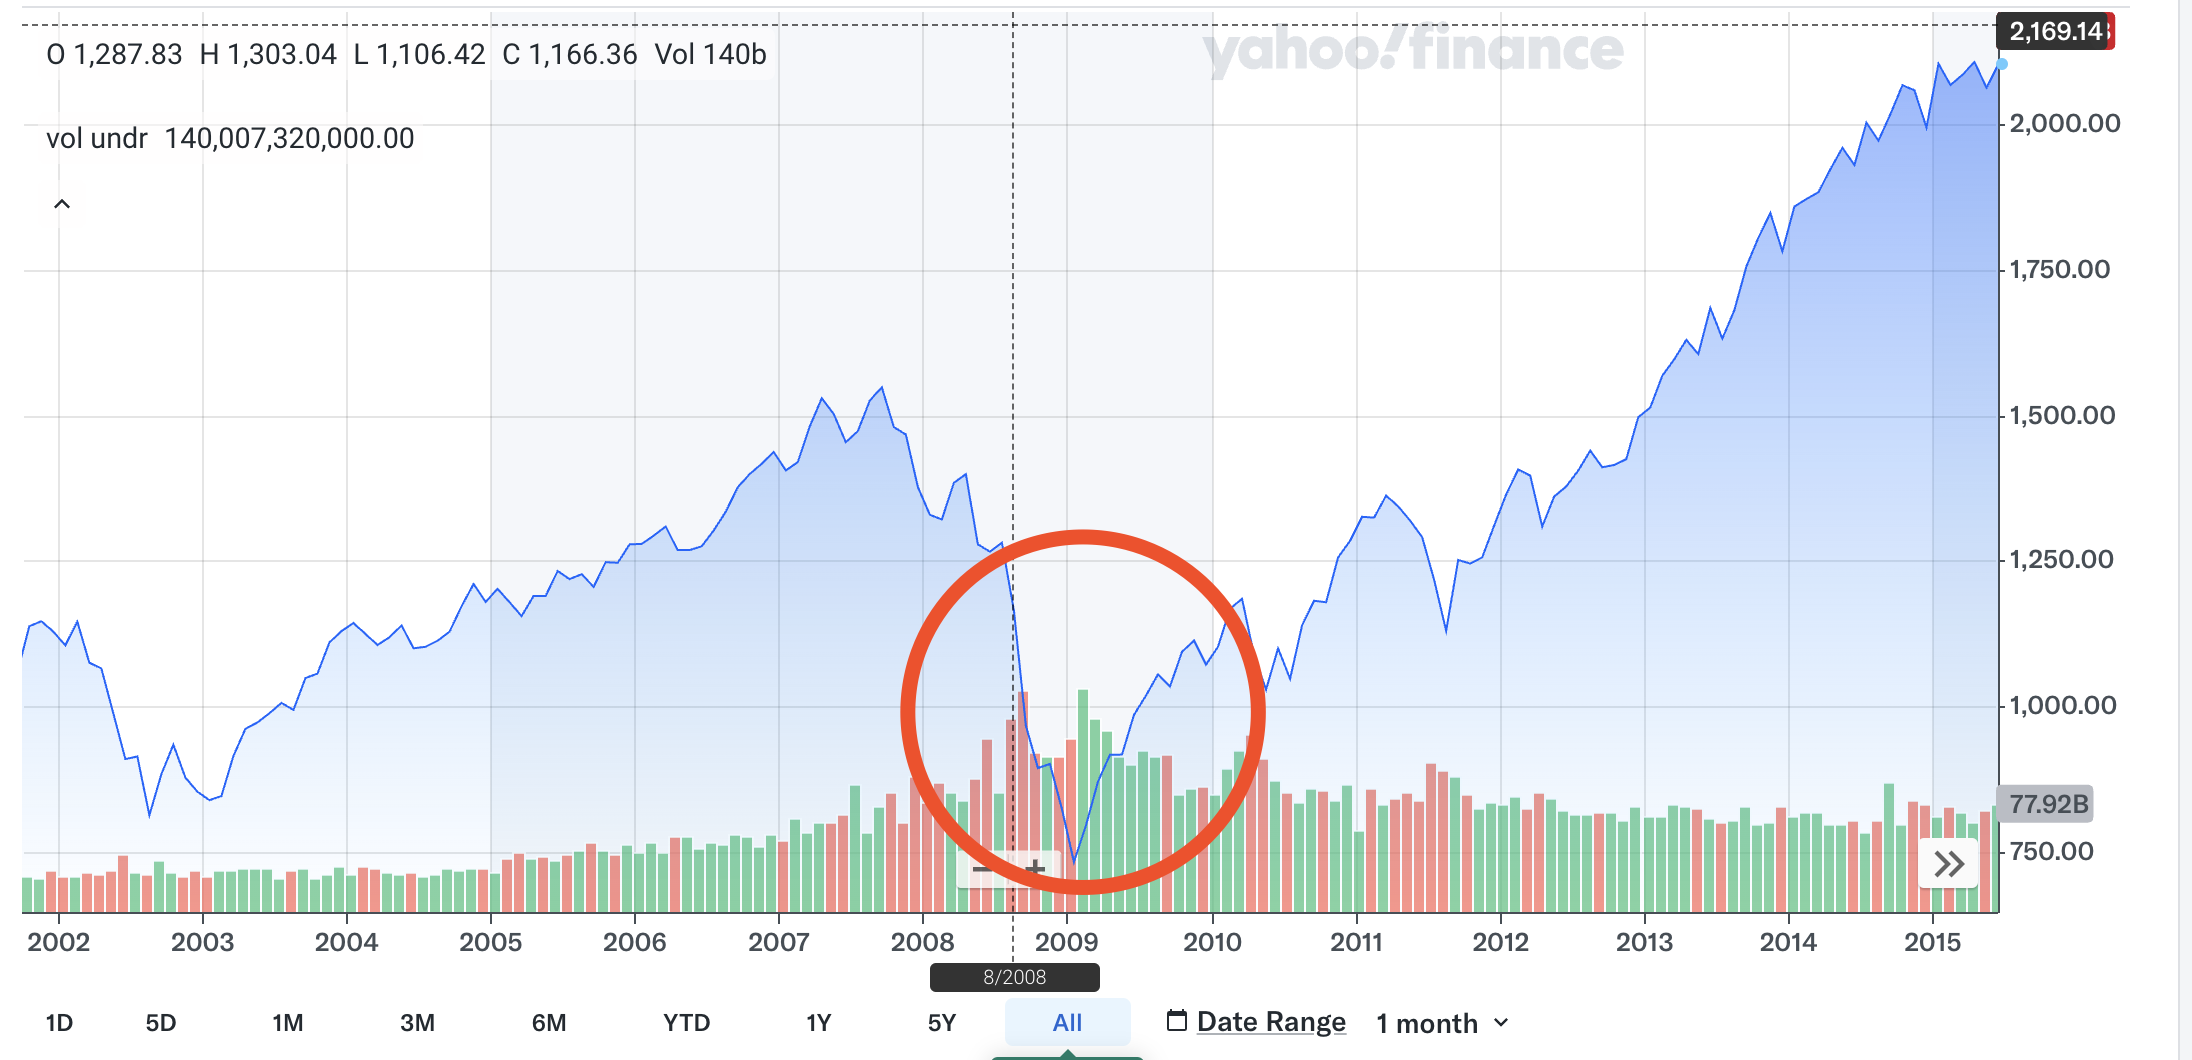
Yahoo Finance is a great primary resource for accessing both historical raw stock data and real-time performance for the S&P 500. On its S&P 500 page, you can monitor daily price changes, market capitalization, and sector breakdowns. The platform provides interactive charts that allow you to find performance trends across various time frames (daily, monthly, yearly, etc.), which can help with developing insights into long-term market patterns. Beyond raw data, Yahoo Finance provides visual graphs and relevant news analysis, making it easier to interpret the data and offering context for key events.
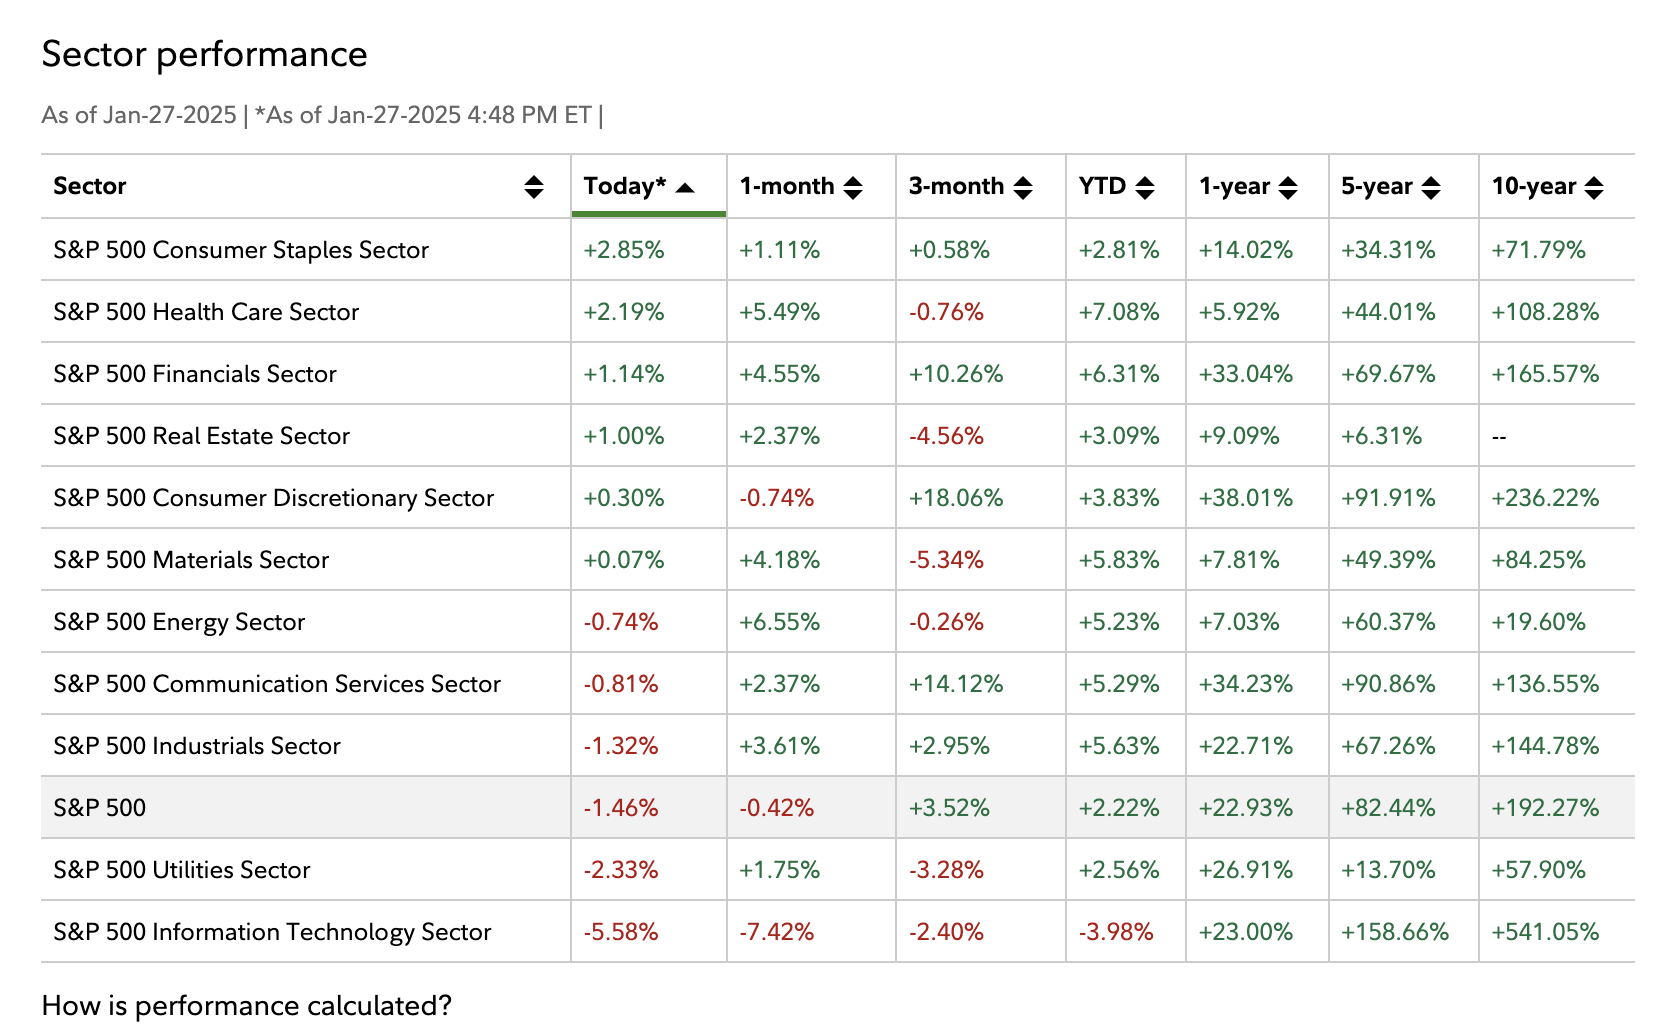
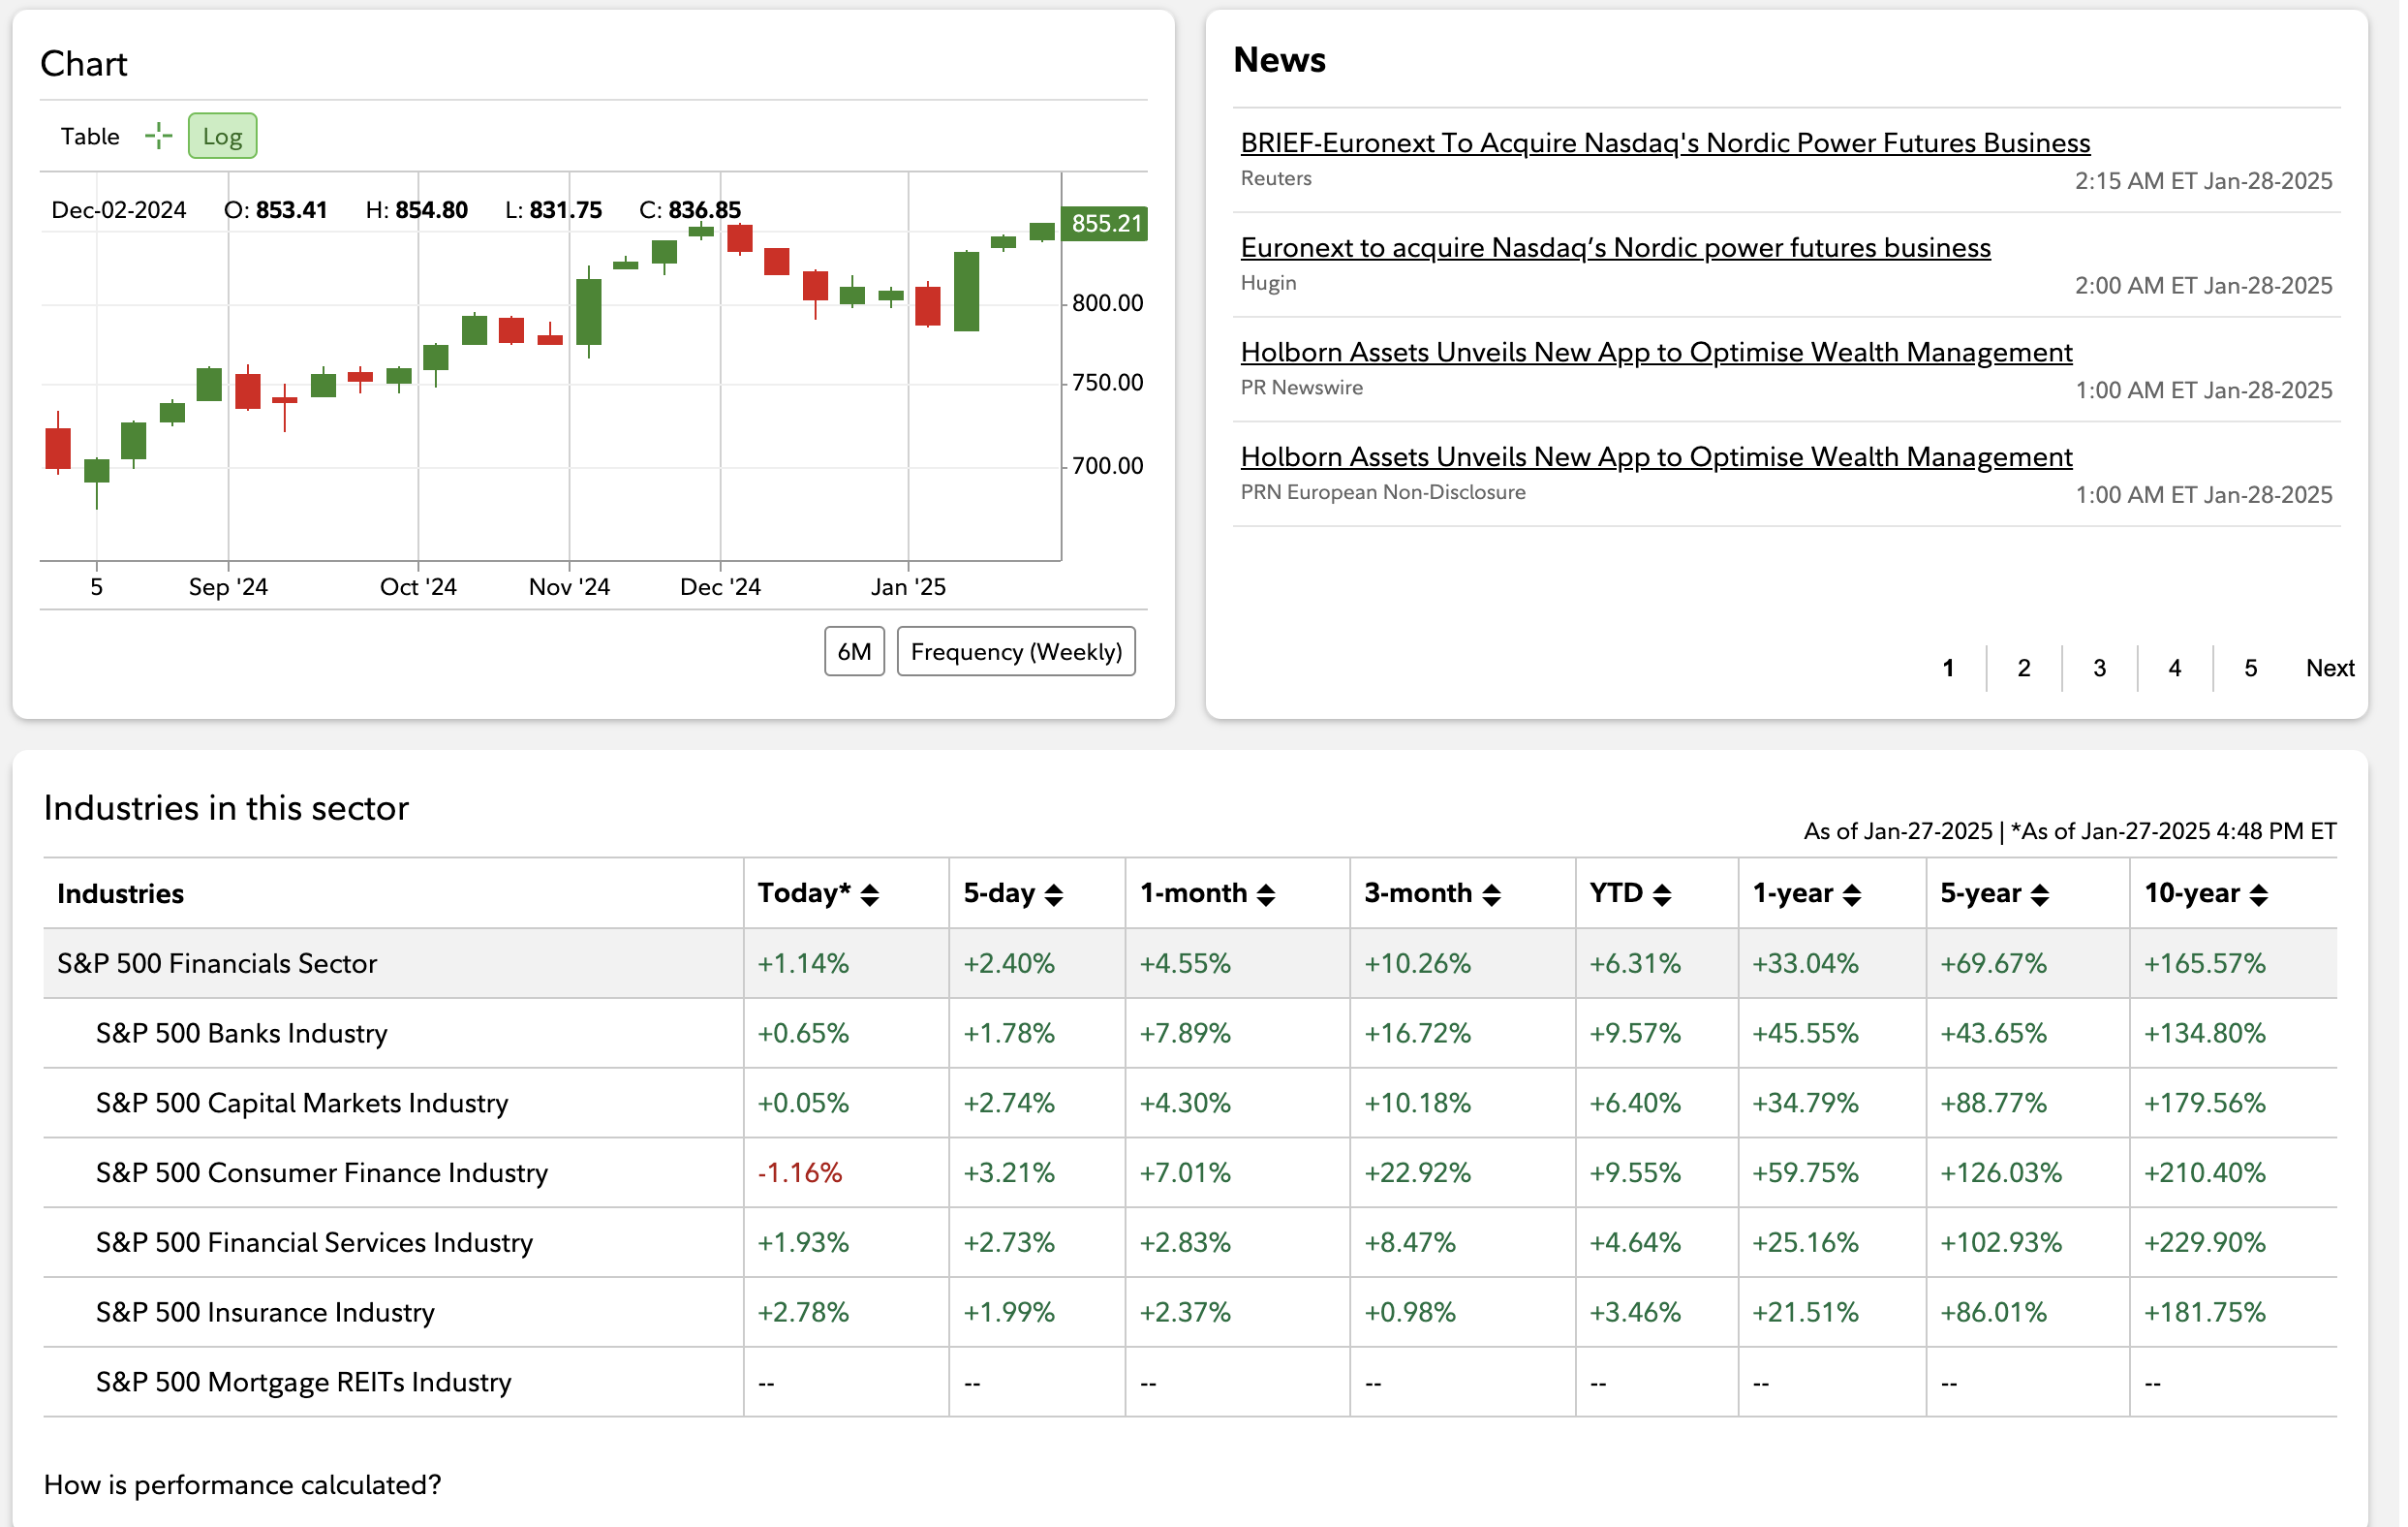
To gain detailed, real-time information on specific S&P sectors like Communication Services, Technology, Health Care, or Consumer Discretionary, you can reference Fidelity’s S&P 500 sector breakdown. This is important if you want to analyze specific parts of the economy or identify which sectors may be driving the market currently. This breakdown can help you identify underperforming sectors that indicate possible economic stress or potential areas for investment.
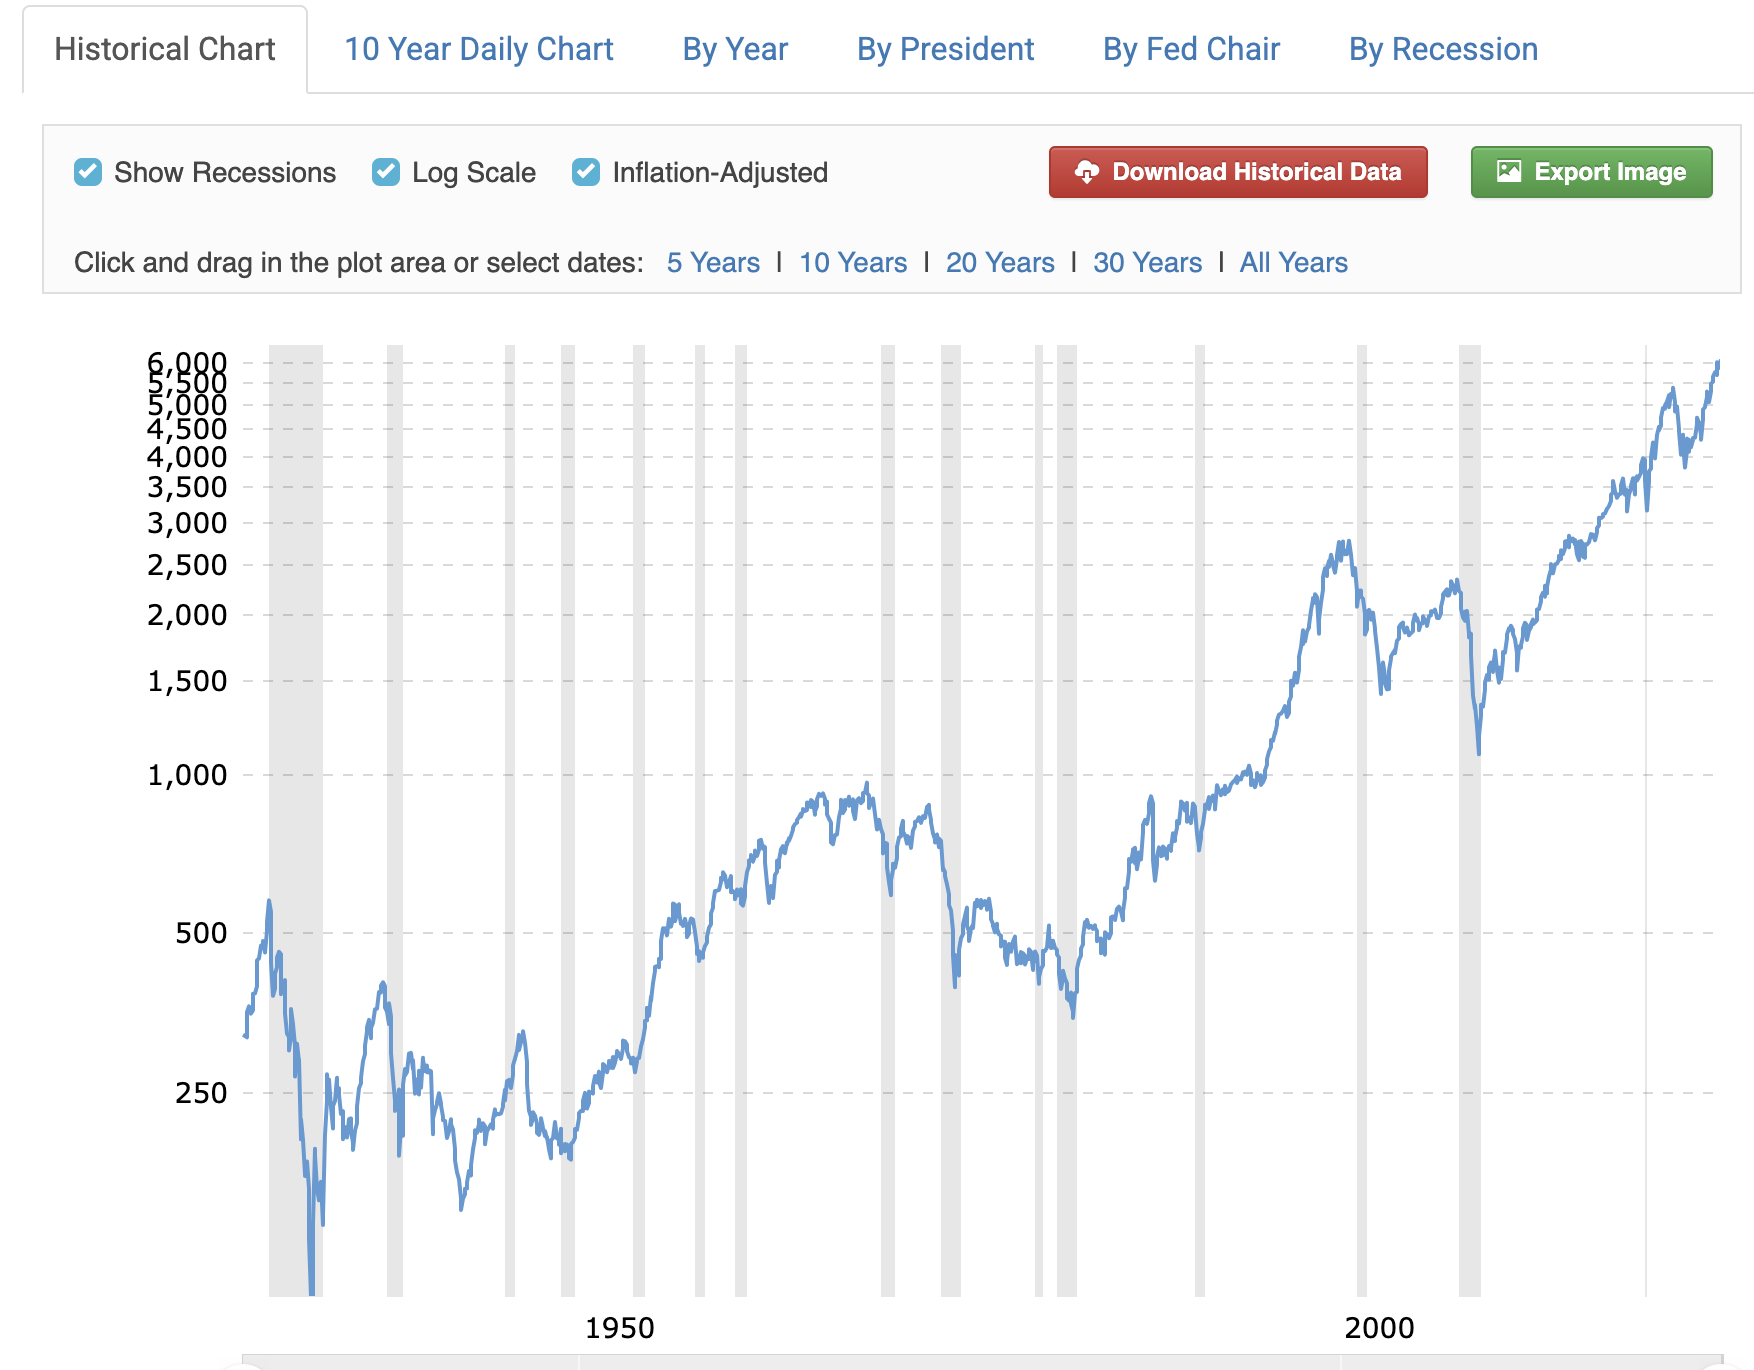
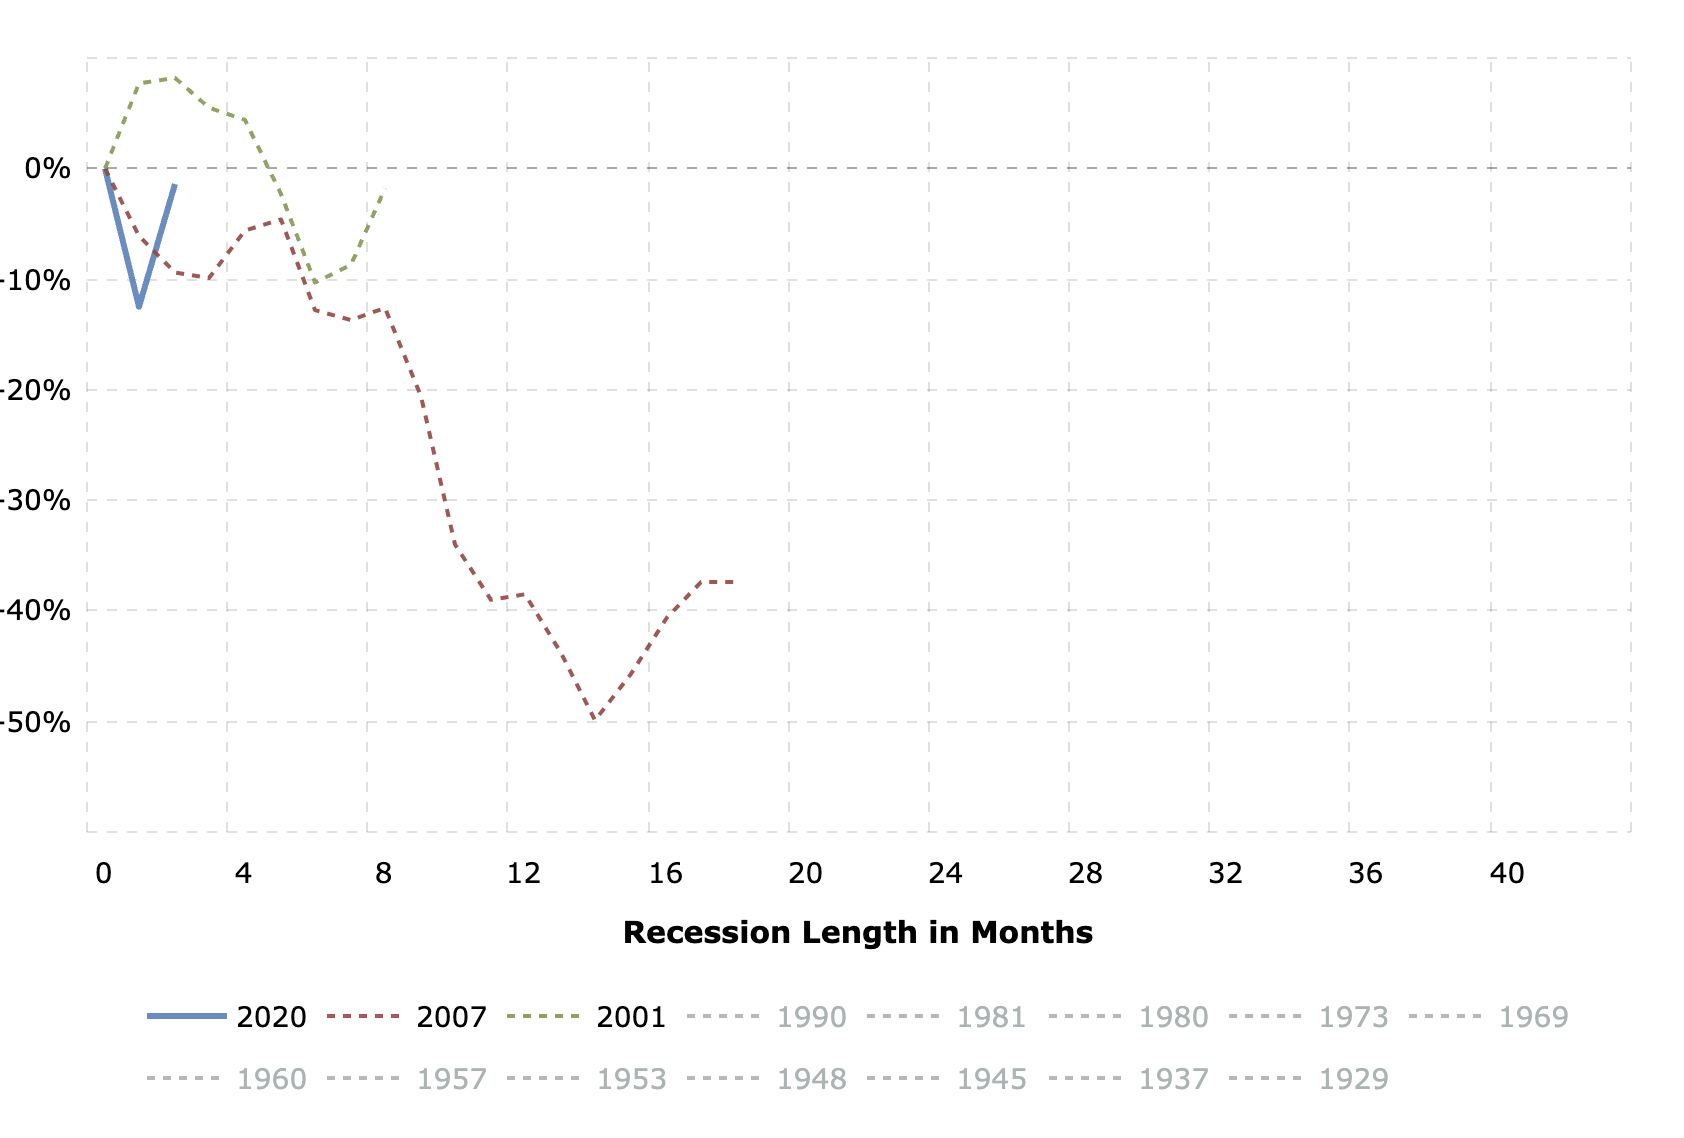
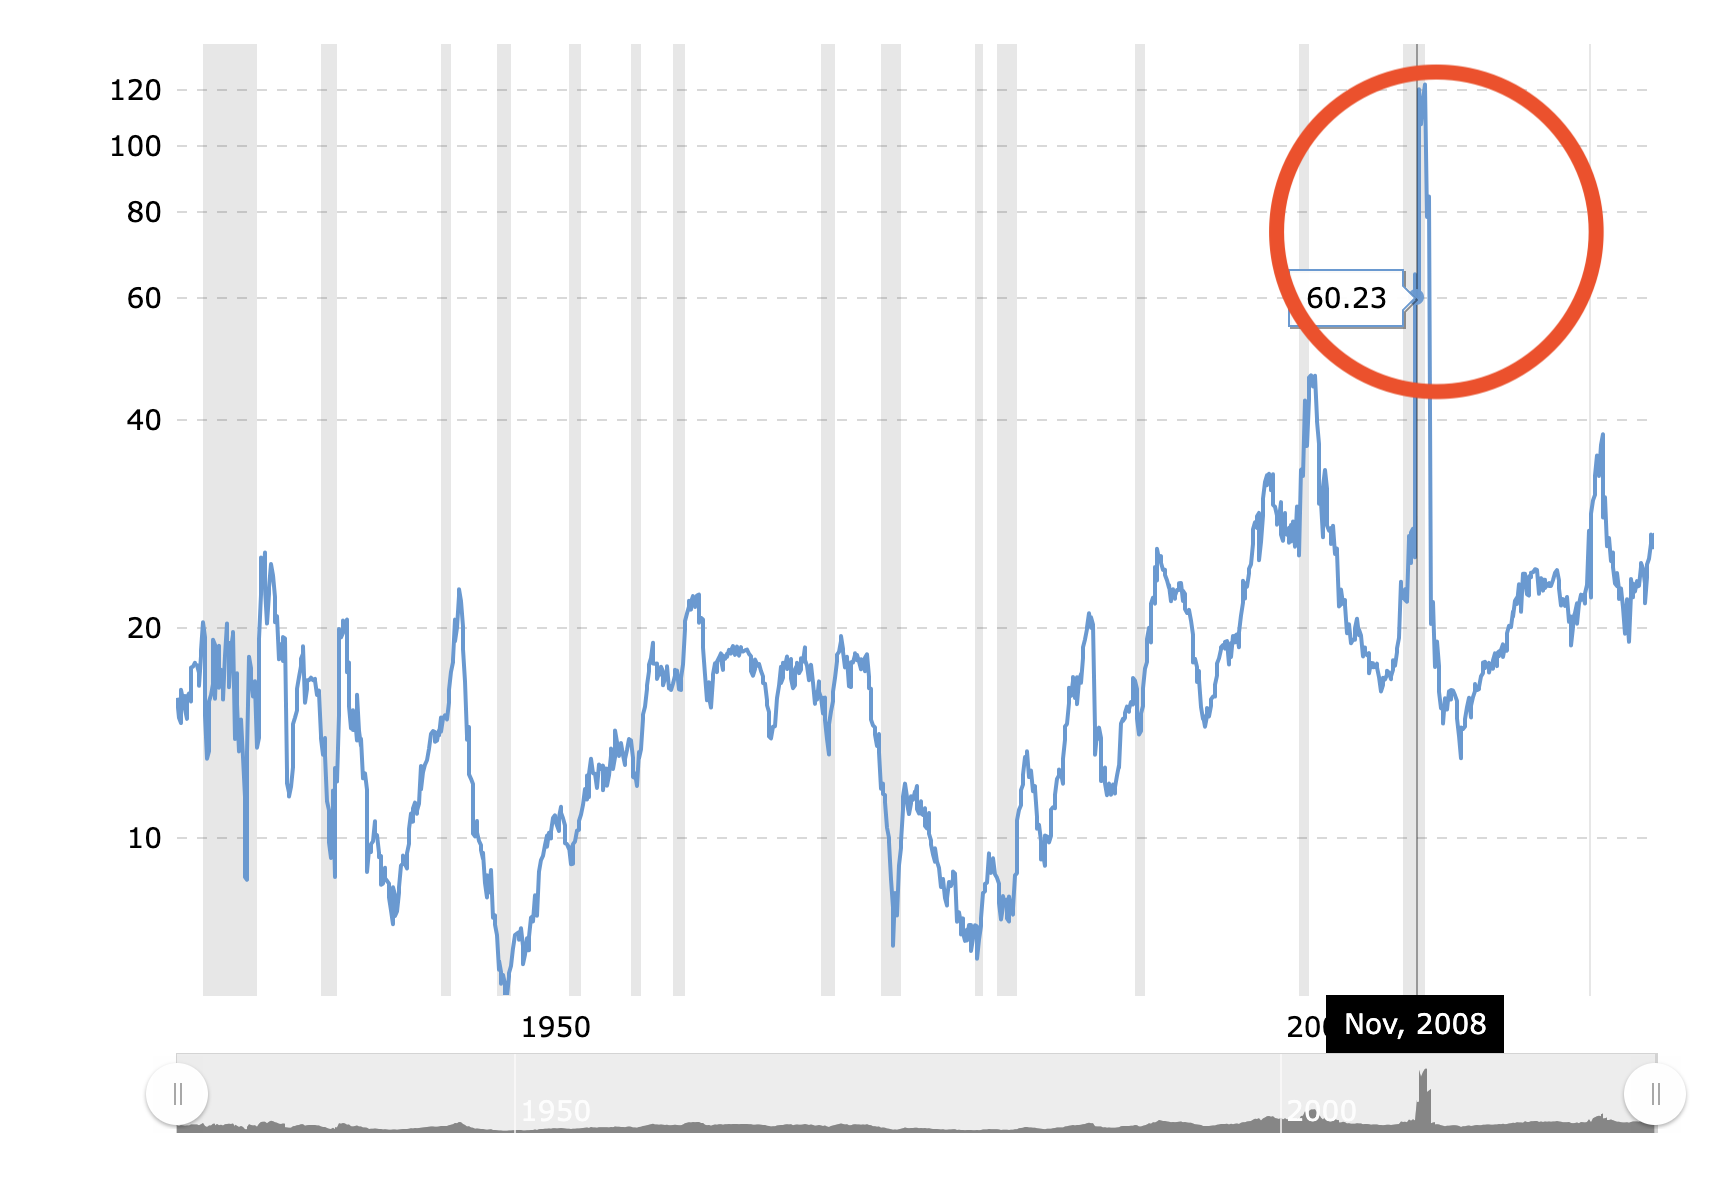
While Yahoo Finance provides essential charts and customizable time frames for raw data, Macrotrends offers more in-depth information. Like Yahoo Finance, Macrotrends' S&P 500 Historical Chart page allows you to choose price points and performance metrics across daily, monthly, and yearly intervals. What sets Macrotrends apart is its variety of comparison charts, such as the S&P 500 Price-to-Earnings (PE) Ratio since 1926, S&P 500 vs. Durable Goods Orders, and S&P 500 Earnings History. Additionally, the platform provides charts that analyze the S&P 500's performance by President, Fed Chair, and recession periods, offering further insights into how different factors influence market trends. For a more detailed view, the S&P 500 Historical Chart page also includes a 10 Year Daily Chart, performance by year, by President, by Fed Chair, and by recession.
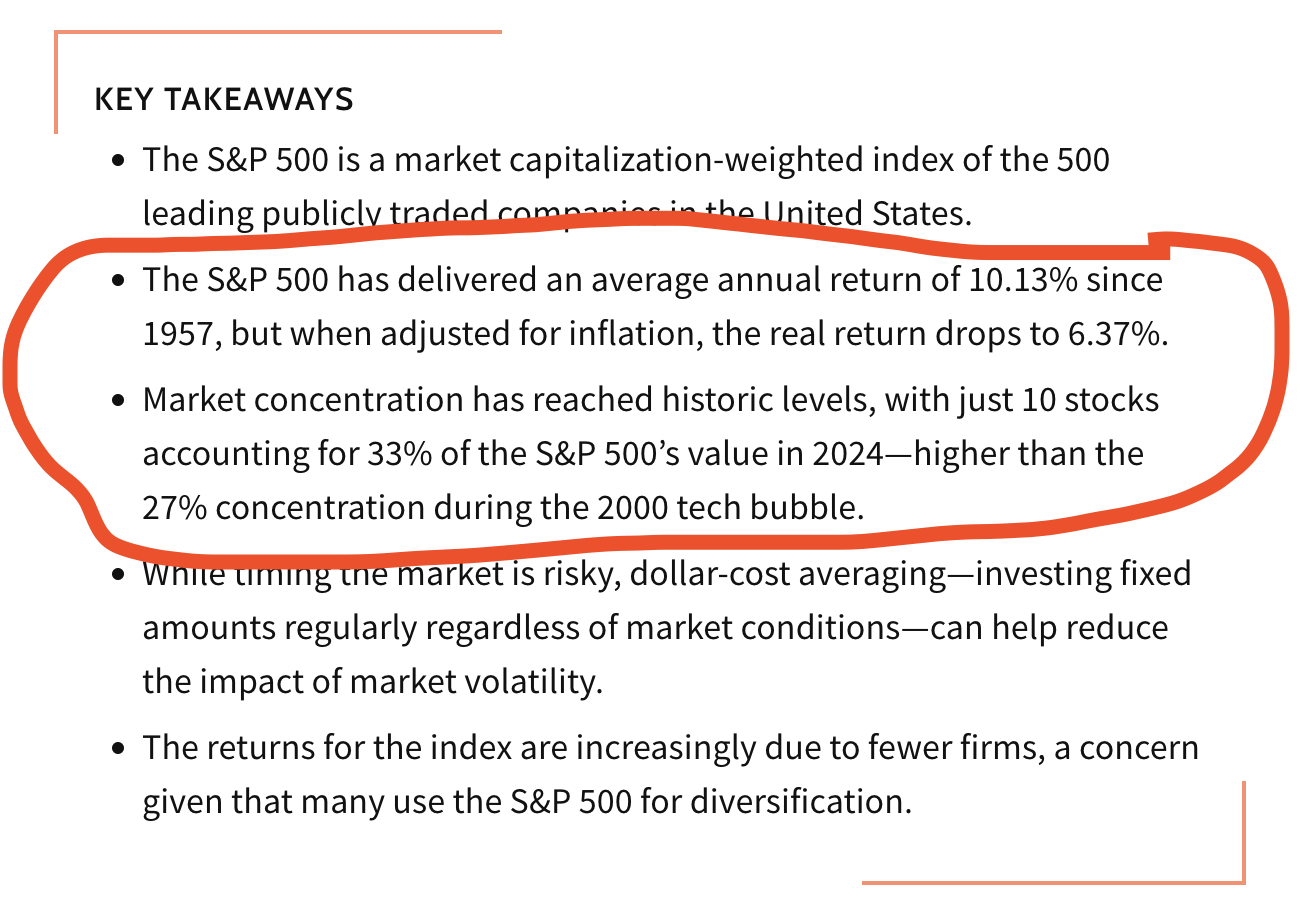
Investopedia uses data and information to create guides and insightful articles about the S&P 500. Their S&P 500 guide covers its purpose, importance in investing, and provides valuable insights. Articles like "S&P 500 Average Returns and Historical Performance" point out that the S&P 500 has delivered an average annual return of 10.13% since 1957, with a real return of 6.37% after inflation. The guide also points out that market concentration has reached historic levels, with just 10 stocks making up 33% of the index's value in 2024, compared to 27% during the 2000 tech bubble. Through detailed definitions, sector breakdowns, and stock weightings, Investopedia helps users gain valuable insights and understand why the S&P 500 is an important tool for investors.
How to Analyze S&P 500 Trends
Typically, consumers analyzing S&P 500 data aim to track performance, benchmark returns, and identify investment opportunities. Yahoo Finance offers real-time data and interactive charts that allow you to compare price fluctuations of the S&P 500 over different timeframes. Let’s say you want to analyze the S&P 500’s performance and identify improvement opportunities. You can use Yahoo Finance to track general S&P 500 price fluctuations and trends. Next, you can use Fidelity's sector breakdown to analyze how different sectors are performing relative to one another. For instance, if you notice that the technology sector is outperforming other sectors, you might want to invest in stocks within that sector or look for companies with strong growth potential. For historical context, Macrotrends offers in-depth charts like the S&P 500 Price-to-Earnings (PE) Ratio, which you can use to assess whether the market or a specific stock is overvalued. By analyzing these metrics, you can determine if the market is in a bubble, potentially leading to a correction. If the PE ratio is high compared to historical trends, it could signal an overvalued market. Finally, Investopedia provides additional context through its articles and guides. For example, by examining Investopedia’s explanation of market concentration or historical returns, you can understand the broader economic forces that could impact the market. If you notice a rise in market concentration, with a few companies dominating the S&P 500, it might indicate increased risks for diversification.
Example: Predicting Economic Recession
-
1. Find Data on Yahoo Finance
Track the S&P 500 index for declines and sharp price drops. Prolonged downturns or a significant drop in the index could be an early warning of a recession.
-
2. Analyze Sector Performance with Fidelity
Use Fidelity’s sector breakdowns to identify which sectors, such as consumer goods or financials, are underperforming. These sectors are more sensitive to economic slowdowns, so their decline can signal broader economic shifts.
-
3. Compare Current Trends with Historical Recessions on Macrotrends
Reference Macrotrends to compare current market trends with past recessions (e.g., 2008 or 2020). Look for similar patterns, such as prolonged sector declines or sharp market contractions.
-
4. Assess Market Overvaluation Using the PE Ratio on Macrotrends
Overlay the S&P 500 Price-to-Earnings (PE) Ratio to evaluate whether the market is overvalued. A high PE ratio can signal that the market is overpriced, which may precede a correction.
-
5. Contextualize Trends with Insights from Investopedia
Investigate Investopedia’s insights on market concentration and inflation-adjusted returns. A rise in market concentration (where a few large companies dominate the index) could signal systemic risks, which may contribute to an economic downturn.